Major League Baseball Graphs The Dirty Details

2003 American League

Also view these related graphs:
American League East
AL as of May 4th
American League Central
American League West

Runs Scored and Allowed

Comments How to Read this Graph
May 25, 2003
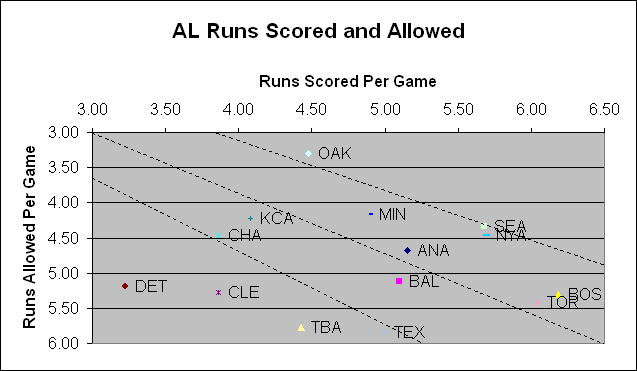
Oakland's defense makes it the best team in the league; they're the only ones above the .600 isobar, and they've allowed the least runs, by far. However, Pythagoras is not bestowing his favor on them, looking east to the other harbor, instead. Boston and Toronto are almost the same team -- the two best offenses in the league -- as are New York and Seattle (who are really close enough to Oakland on the isobar to call it even). The Twins and Angels are solidly in the upper middle section, and could move up in the future. Detroit, Cleveland and Tampa Bay continue to bring up the rear. Keep that poor runs-allowed record of Texas in mind as we look at the other graphs.
TeamWins +/-
ANA-2.11
BAL-1.41
BOS 2.28
CHA1.69
CLE 0.10
DET -1.99
KCA2.38
MIN1.13
NYA-1.45
OAK-2.17
SEA 1.06
TBA 0.34
TEX1.61
TOR-0.82


OBP and SLG by Team
TeamRuns +/-
ANA0.24
BAL0.43
BOS 0.41
CHA-0.30
CLE -0.22
DET 0.13
KCA-0.61
MIN-0.02
NYA-0.07
OAK0.02
SEA 0.43
TBA 0.08
TEX-0.68
TOR0.33

Comments How to Read this Graph
May 25, 2003
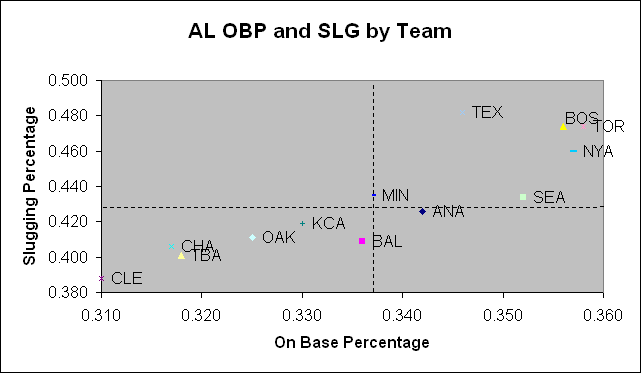
As mentioned, Boston and Toronto are the best offensive teams in the league, but the Yankees also deserve to be right with them. The first two teams are making more of their "run elements." Seattle's OBP is very good, but their average slugging holds back their offense. Texas, on the other hand, has the best slugging in the league. But their OBP and, more importantly, their unlucky distribution of offensive elements is holding back their offense. Look for Texas' offense to improve, and Seattle's and Boston's to fall back a bit.

Detroit's incredibly anemic offense is literally "off the charts." They're somewhere down near your "Start" button.


Pitching and Defense
TeamDER +/-
ANA0.002
BAL-0.007
BOS 0.011
CHA-0.004
CLE 0.003
DET -0.001
KCA0.009
MIN0.007
NYA-0.007
OAK-0.006
SEA -0.006
TBA 0.001
TEX0.003
TOR0.002

Comments How to Read this Graph
May 25, 2003
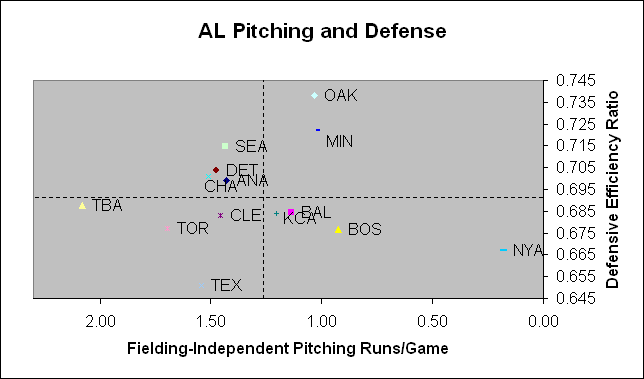
Take a look at Oakland. Their pitching is among the best in the league, but it's their fielding that really makes them stand out. Maybe that pick up of Chris Singleton really was another act of Beane genius. Whatever. Conversely, the Yankees own easily the best pitching performance in the league, but their fielding is the second-worst (the Yankees have a flaw!). Now look at Texas: their pitching is only slightly worse than average, on a par with a host of other teams such as the Angels and Mariners. But it's their fielding, worst in the league, that sinks them.

Major League Baseball Graphs The Dirty Details