National League Central Team-by-Team
Review the National League Graphs
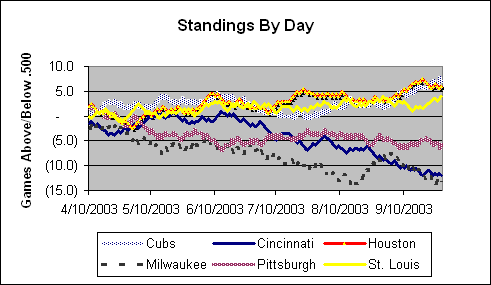
Here's a view of the NL Central standings on a day-by-day basis, starting with the tenth game of the season.
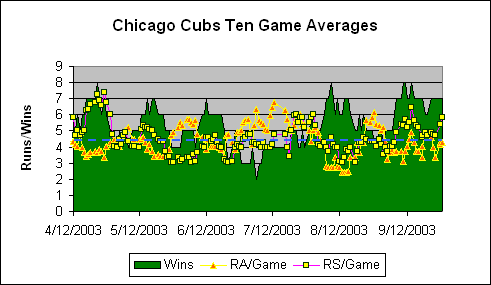
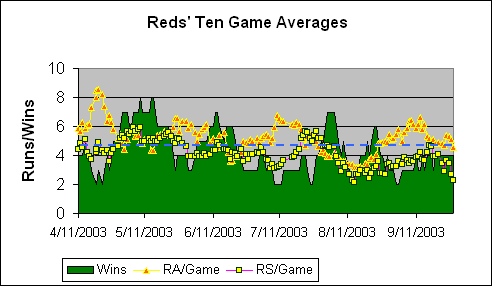
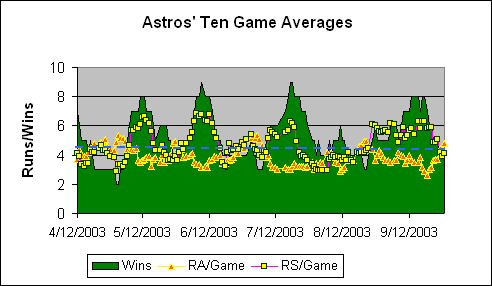
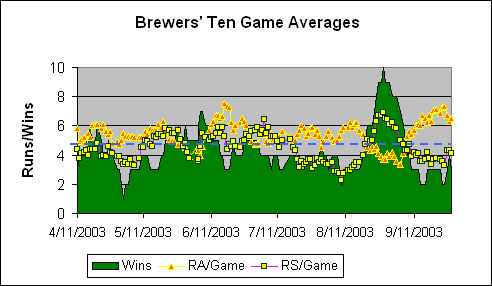
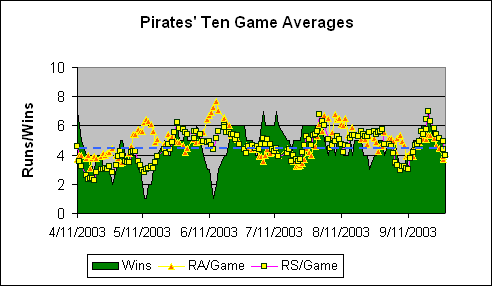
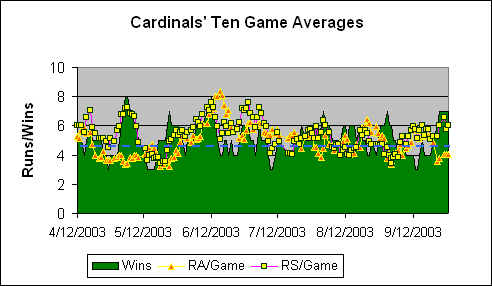
Following are graphs of the ten-game averages for each team. The green area represents the number of games each team has won of its last ten played. The two lines are 10-game moving averages of runs scored and allowed per game over the same time period, adjusted for park factors. The fixed line represents the league average number of runs scored per game.
The tables list vital stats by month. FIP stands for "Fielding Independent Pitching" and is based on the following formula: (13*HR+3*BB-2*K)/IP. DER stands for "Defense Efficiency Ratio" and is essentially calculated this way: Non-catcher putouts/# of balls hit fairly (not including HRs). The DER stats on this page are based on limited data; the trend between months per team is more valid than the absolute number.
|
Chicago Cubs Comments
August 31, 2003 The Cubs' pitching returned to greatness in August, and the Cubs are now in the thick of things. One of the overlooked stars of this team has been Carlos Zambrano, who is now ninth among all National League pitcher in Win Shares. Prior is fourth, and Wood is 17th. The Cubs made a number of trades to offset the loss of Corey Patterson and get back into the race. Among those trades, Kenny Lofton and Aramis Ramirez have been great additions to the team. Over the last twenty games, Ramirez leads the team in home runs, and Lofton's OBP has been near .400. View Individual Player Win SharesView individual player stats |
|
Cincinnati Reds Comments
August 16, 2003 The Reds really swooned in the beginning of July, losing eight in a row. Though they picked it up just before the All-Star break, they did it against Milwaukee. So it doesn't really count. They also had a nice streak at the end of July, beginning of August, against the Mets, Rockies and Giants. As you can see, however, their runs scored was about even with runs allowed. They achieved their success by winning four one-run games and losing none during that span. They're now 24-16 in one-run games and they're still beating Pythagoras by five games. By the way, their top two leaders in Win Shares (Guillen and Boone) are no longer with the team. View Individual Player Win SharesView individual player stats |
|
Houston Astros Comments
August 31, 2003 Love this graph. Notice how the Astros' wins almost exactly match their runs scored? Talk about your causality. What this graph also says is that the Astros' pitching and fielding have been very consistent, and the team's success rides on its offense. Actually, Houston's fielding stats are enigmatic. Their team zone rating is the worst in the league, but their DER and fielding win shares are near the top of the league standings. I have no idea why this is, but one theory is that Houston's park is affecting the stats in some way. Another is that their pitching staff deserves credit for controlling batted balls. Speaking of pitching, the Astros' top two leading Win Share pitchers are relievers. View Individual Player Win SharesView individual player stats |
|
Milwaukee Brewers Comments
August 31, 2003 The Brewers had a great run in the second half of August. As you can see from the chart, the Brewers' offense and defense both had their best stretches of the season. This is one of those teams where you want to click on the "last twenty games" statistics listed below. Geoff Jenkins was awesome before getting hurt, but the Brewers also received contributions from Podsednik (Rookie of the year in the NL?), Sexson, Ginter, Helms -- even Brady Clark. Their hot pitchers include Doug Davis, Kinner, Obermueller and Franklin. That list tells you everything you need to know about the sustainability of their success. But why quibble? View Individual Player Win SharesView individual player stats |
|
Pittsburgh Pirates Comments
August 31, 2003 The Pirates aren't a bad team. At least, they weren't until they started trading players with Boston. But look: their team OBP is right around league-average (despite a poor opening month) and their slugging has improved every month. Unfortunately, their fielding has gotten worse virtually every month. And their pitching leaves a lot to be desired. Unfortunately, this team's immediate future is bleak. Most of their Win Share leaders have been traded away. Pirates' fans are probably in for a long (albeit necessary) haul. View Individual Player Win SharesView individual player stats |
|
St. Louis Cardinals Comments
August 31, 2003 The Cardinals' offense was awesome for the first three months, and even their fielding was strong the first two months. Ever since the All-Star break, however, the Cardinals' have been decidedly average: wins, runs scored and runs allowed have all run around the league mean. The pitching had its worst month in August. Both the starters and the bullpen are to blame: Starting ERA: 4.47 and Bullpen ERA: 4.92. Other bleak stat: Cardinals are now 11-21 in one-run games. Finally, no team, not even the Giants, is as dependent on one player as the Cardinals are on Pujols. He accounts for 17% of their Win Shares. View Individual Player Win SharesView individual player stats |